A rice paddy is a shallow basin: a level field, enclosed by low earth walls, that stands under a few centimeters of water for most of the growing season. The water it needs is often right next door, in a river or canal running along the field. The catch is that it runs a little too low. A stream sits in its bed, a meter or three below the top of its own bank, and water does not climb banks on its own.
The gap is small, but it has to be closed every day of the season. Today a pump takes care of that, and nobody gives the problem much thought. For most of history it cost a great deal of time and muscle: buckets, sweeps, and treadle-driven chain pumps, with people walking in place for hours to push water up the bank.
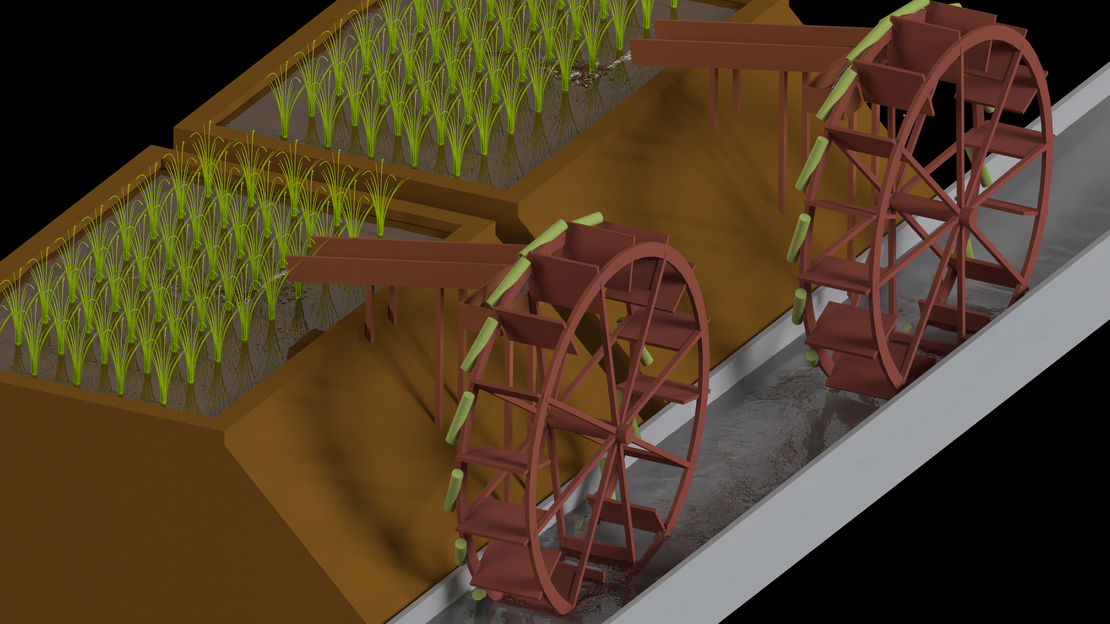
The tongche (筒车, “tube wheel”) hands that job to the river. A large wheel stands in the stream, the current pushes its paddles, and bamboo tubes tied to the rim dip into the water at the bottom, ride up full, and tip their contents into a trough at the top. From there the water runs down a flume and into the field by gravity. The river is the water source and the motor at the same time. No fuel, no operator, no lunch break. The wheel can lift water by a little less than its own diameter, and it needs a current to turn it, but where a stream flows past a field, it works around the clock. Wheels of this kind appeared in China in the Tang dynasty (618 to 907 CE), they are drawn and described in Wang Zhen’s agricultural treatise Nong Shu of 1313 CE, and in parts of China, Vietnam, and Indonesia they are still at work today.
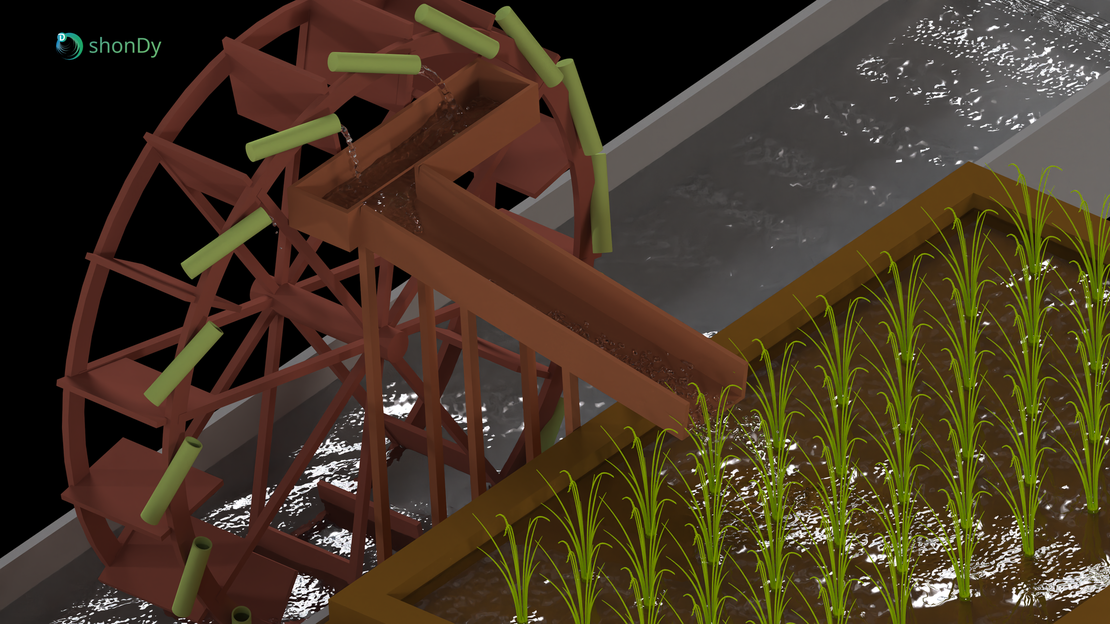
It is easy to file such a machine under “charming rural technology”. That undersells it. A society in which nearly everyone has to grow food has no hands left for anything else. Every device that lets fewer farmers feed more people releases labor, and that labor is what builds canals, casts iron, prints books, and eventually writes simulation software. Irrigation machines were one piece of that puzzle. In the centuries in which wheels like this spread along China’s rivers, rice yields rose, the population passed one hundred million, and the same society came up with movable type, the compass, and gunpowder. A wheel that waters a field around the clock, for free, is not a footnote in that story.
Back then, nobody ran a CFD study before building one, of course. The design was refined over generations by people who could see perfectly well whether water arrived in the field or not. So this case study is more than a thousand years late for the design review. It still asks the two questions a careful engineer would ask today: how much water actually arrives at the top, and what does the wheel do to the stream it stands in? It is also a small tribute to the engineering marvels in the history of mankind.
Case Description
Geometry
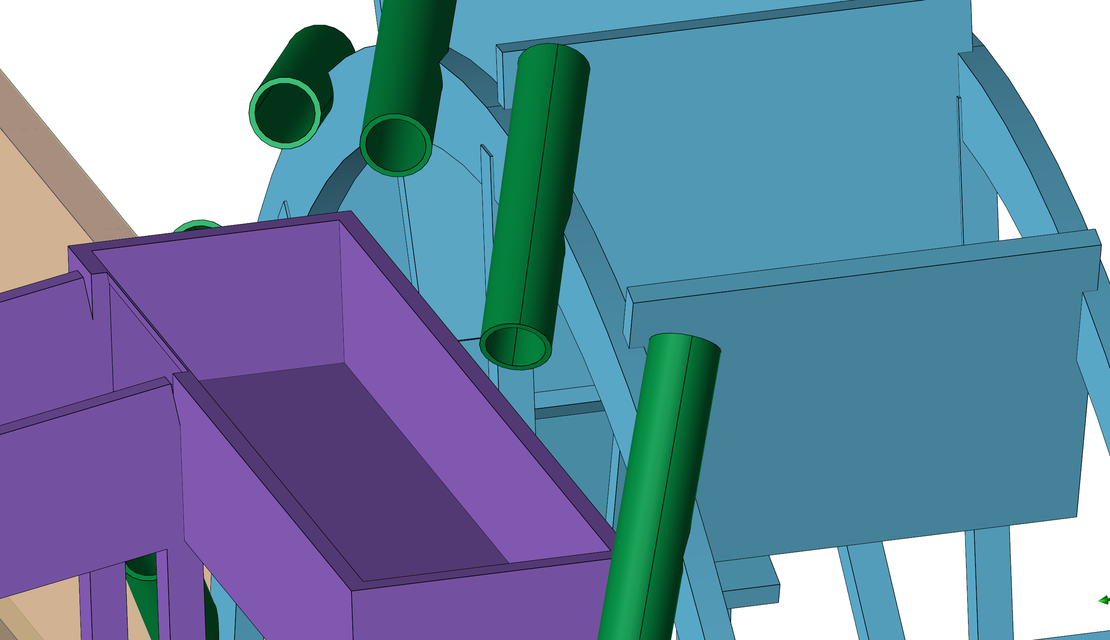
The wheel is not a replica of a specific historical machine. It is a parametric model, generated by script and then adjusted by hand, that follows the traditional layout: a wooden wheel with an outer diameter of 4.2 m, 16 radial paddles, and 16 cylinders on the rim that represent the bamboo tubes. Each cylinder has an inner length of 590 mm and an inner radius of 50 mm, which gives a volume of 4.6 liters, and is closed at one end, just like a real bamboo segment is closed by its node. The tubes sit on the trough side of the rim and are tilted by 20° in two directions: sideways, so that the open end points towards the trough, and inwards, so that the open end points upwards at the bottom of the wheel and downwards at the top. This way they fill at the bottom, hold their water on the way up, and pour sideways out of the wheel plane near the top.
Next to the wheel, a wooden trough, 1.7 m long, catches the water about 3 m above the stream. A flume with a slope of 10° carries it across the embankment into a rice field whose floor lies about 2 m above the water level in the channel. Embankment and field complete the scene, so that the water can be followed all the way to its destination.
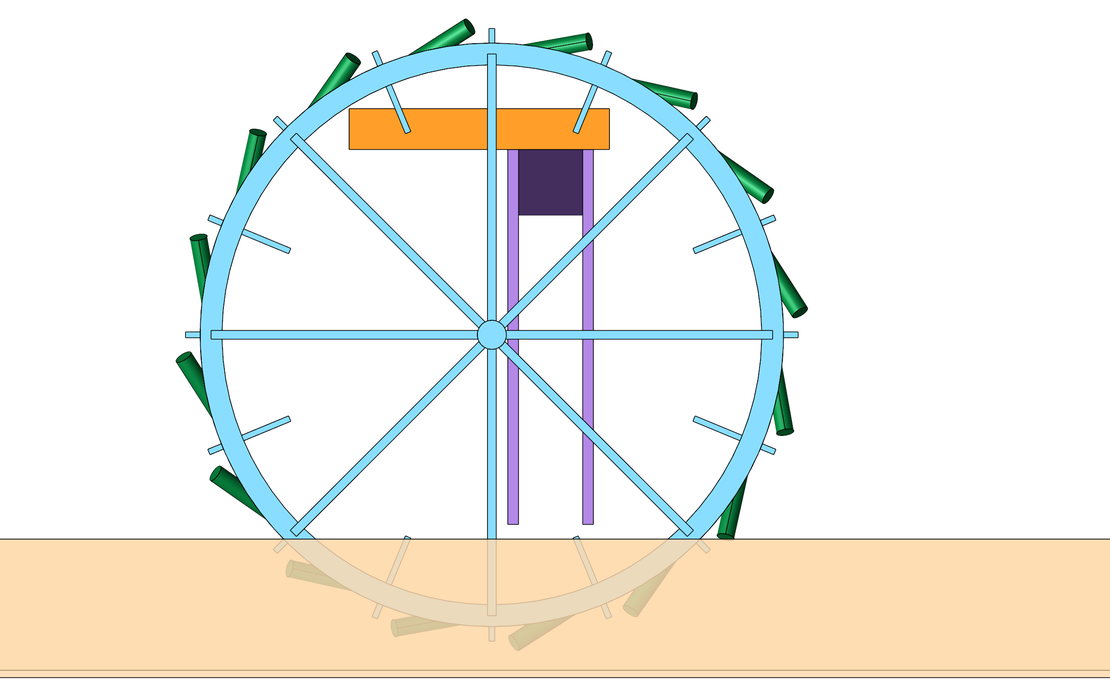
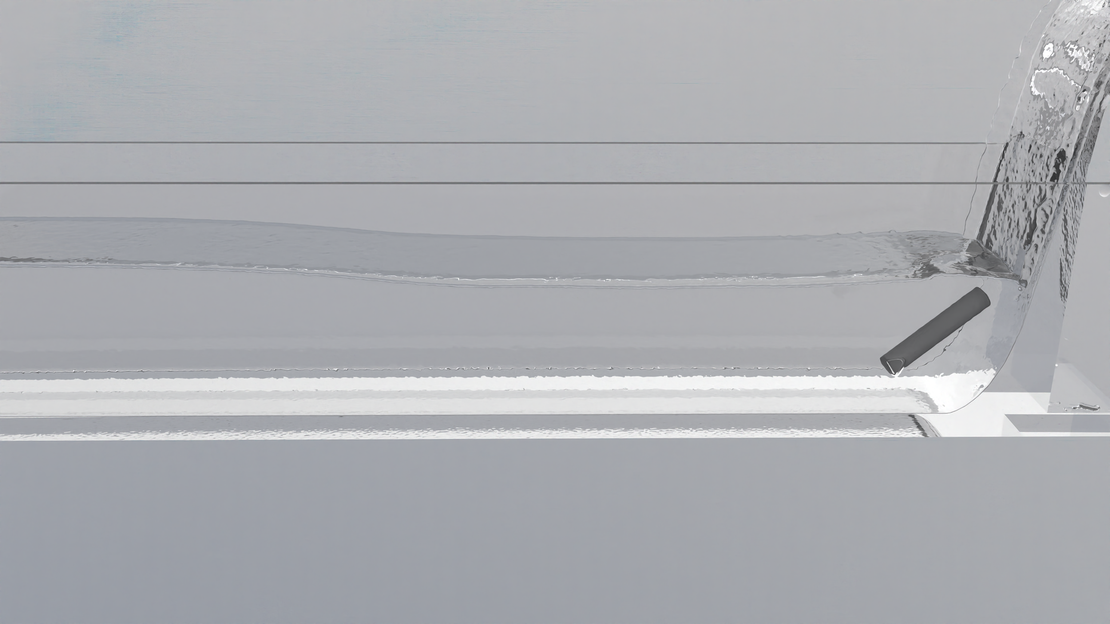
The stream is modeled as a straight rectangular channel, 21 m long and 1.9 m wide. The wheel sits about 7 m downstream of the inlet and is offset towards the bank: the 0.8 m wide paddles and the tubes take up the side next to the trough, and a free lane of about 0.75 m remains on the other side. The paddle tips pass 10 cm above the bed and reach about 0.5 m deep into the water.
At the downstream end of the channel, a sill with a height of 18.5 cm spans the full width. It holds back the outflow, so that the water backs up and slows down, and the depth at the wheel stays at about 0.6 m. Without it, the water level would drop towards the open end and the wheel would run in a much shallower stream.
Fluid and Simulation Setup
The water enters through an inlet that covers the channel cross section up to the target water level. The inflow is ramped up over the first 4 s to avoid a surge wave. Turbulence is modeled. The trough and the channel are fixed walls, and the wheel is a rigid body that is free to rotate about its axle.
| Parameter | Value |
|---|---|
| Fluid | Water |
| Fluid density | 1000 kg/m³ |
| Inflow | 1.125 m³/s (approx. 1 m/s) |
| Water depth | approx. 0.6 m |
| Channel | 21 m × 1.9 m |
| Wheel diameter | 4.2 m |
| Paddles / tubes | 16 / 16 |
| Tube size (inner) | Ø 100 mm × 590 mm, 4.6 l |
| Wheel motion | free rotation, driven by the flow |
| Particle radius | 7 mm |
| Particle count | up to 8.8 million |
| Simulation time | 70 s |
The wheel has no drive of its own. It is set in motion by the stream alone, exactly like the original, so its speed is a result of the simulation and not an input. The same holds for everything that follows from it: how fast the tubes pass through the water, how full they get, and how much they deliver.
This is exactly the kind of problem in which a meshless method feels at home. The wheel rotates through the free surface, 16 small containers scoop water out of the main flow, carry it away as fully detached volumes, and release it as free-falling jets three meters higher. In shonDy the wheel is simply a rigid body that the flow pushes around, and the water does the rest. There is no mesh to deform, slide, or rebuild.
Evaluation
Two results come straight out of the solver. The angular velocity of the wheel is recorded for the rigid body, and the flow rate into the trough is counted by a sampling window placed over the trough. Both are available for the full 70 s and are averaged over the last 10 s, from 60 to 70 s, which covers about 13 paddle passages.
Everything about the stream itself is derived from the particle data. Over the last 10 s the simulation exports a snapshot every 0.1 s, 100 snapshots with about 7.9 million particles each, and these are averaged in time by sorting the particles into cells:
- Two longitudinal sections through the channel. Section A-A runs through the free lane beside the wheel, section B-B through the middle of the wheel. Each takes the particles within ±4 cm of its plane and bins them into cells of 2.5 × 2 cm, about 240 samples per cell over the 100 snapshots. The free surface in each section is the top of the highest particle in each column, and its movement over time is recorded as well.
- Two cross sections, 4 m upstream and 7 m downstream of the wheel axle, binned the same way. They also give the flow rate through the channel before and after the wheel.
- A plan view of the whole channel, built from vertical columns of 3 × 3 cm. Each column yields the water depth, the discharge per meter of width, and from the two the depth-averaged velocity. The water surface is again taken from the highest particle in the column.
Water that the tubes have already lifted out of the stream hangs above the free surface and must not enter these averages. It is excluded by a simple rule: in every column the water body is followed upwards from the bed, and everything above the first air gap wider than 5 cm is dropped.
To put a number on the wake, the depth-averaged velocity is compared across the channel width. Its spread, the standard deviation across the width at a given position along the channel, is small for a uniform flow and grows with every disturbance. The undisturbed value is taken from the stretch 5 to 6 m upstream of the axle, and the wake counts as recovered once the spread has fallen back to within 25% of it. The same measure is computed for the free lane alone.
One caveat applies to all channel results: even in the last 10 s the channel is not perfectly steady. It is still filling very slowly, at about 1% of the inflow. Where this matters, in the mass balance across the wheel, the stored water is accounted for.
Results
Water for the Rice Field
First the whole machine at work. The rendered sequence follows the water from the stream to the field in three views: the full scene with the wheel, the trough, the flume, and the paddy; a look from the field up the flume to the trough, where the tubes empty one after the other; and a close-up at water level, where the paddles sweep through the stream and the tubes dip in and come up full. Everything that moves in these shots, the wheel included, moves because the simulated water pushes it.
Behind the pictures sits a 70 s transient simulation, and the first thing to settle is whether the wheel in it has actually reached a steady operating point. That is best seen in the unrendered side view of the whole run, with the water colored by velocity.
The channel is empty at the start, so the first water arrives as a shallow, fast sheet and spins the wheel up to about 10 rpm. After roughly 28 s the backwater from the sill at the end of the channel reaches the wheel. The water gets deeper and slower, and within two seconds the wheel drops to half its speed, where it stays. The fast phase is a start-up effect of the simulation; the operating point of the wheel is the one in the deep, slow stream.
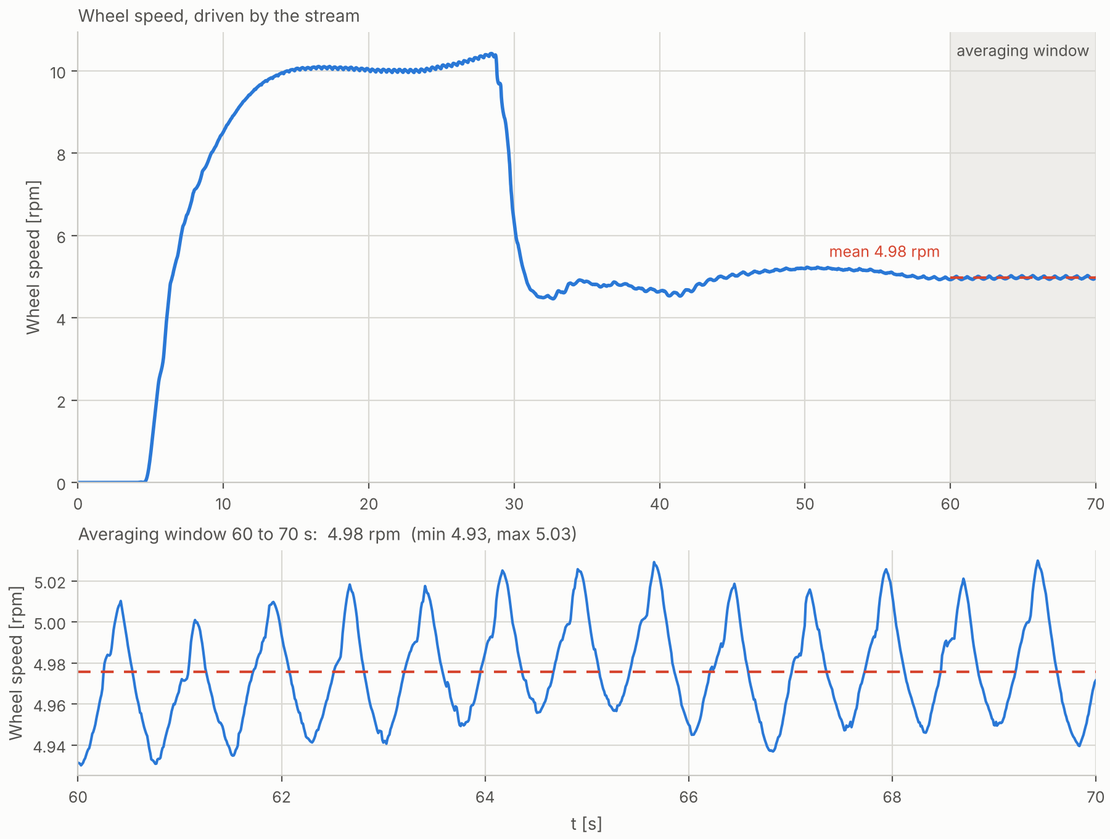
Driven by the stream alone, the wheel settles at 5.0 rpm, one revolution every 12 seconds, with the paddle tips travelling at 1.1 m/s. Between 60 and 70 s the speed varies by only ±1%, and the small ripple that remains has a period of 0.75 s: it is the rhythm of the 16 paddles entering the water one after the other.
The close-up shows the business end of the machine. Each tube has dived below the surface at the bottom of the wheel and filled. On the way up, its tilt keeps the opening above the closed end, so most of the water stays inside. Past the top, the opening drops below the closed end and the tube empties sideways into the trough, from where the water runs down the flume to the field. Some water is spilled on the way up and some misses the trough. The simulation does not pretend otherwise, and neither does the real wheel.
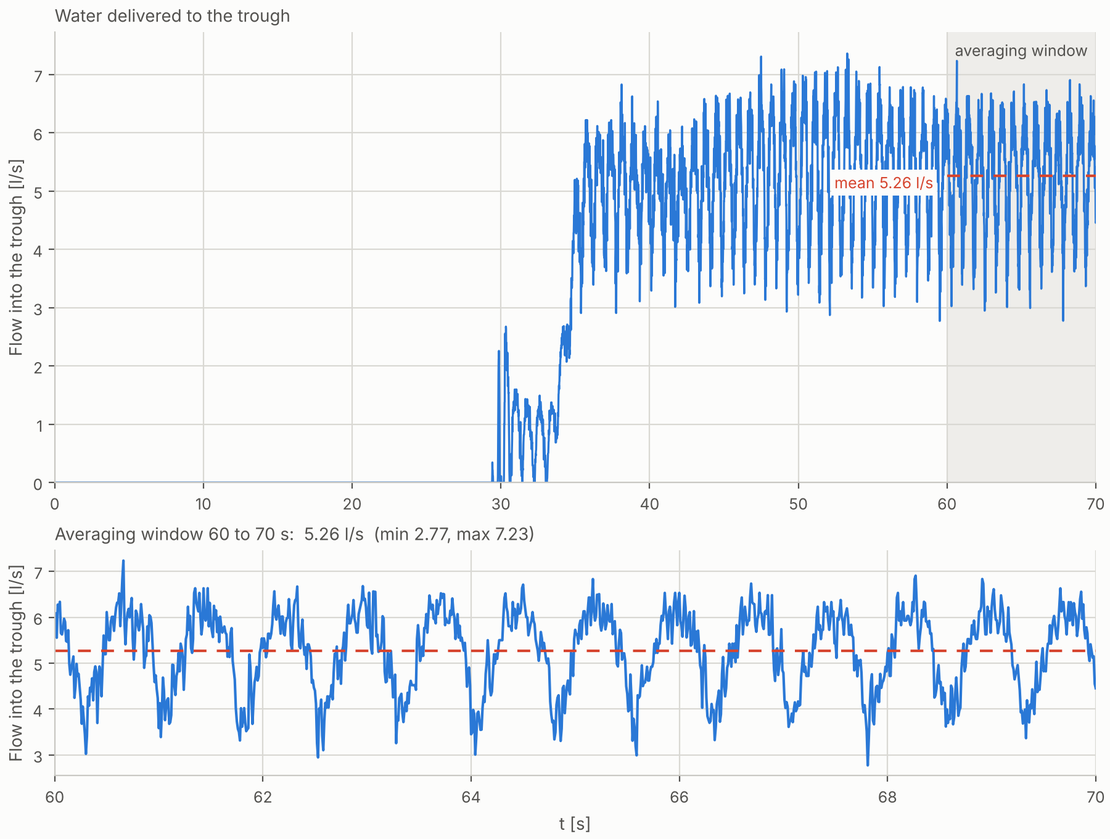
The number that matters to the farmer: on average 316 liters per minute arrive in the trough, or 5.3 l/s. With 16 tubes passing the trough every 12 s, that is about 4.0 liters per tube, a good 85% of what a tube can hold. The delivery is not a steady stream. It pulses between about 3 and 7 l/s, once for every tube that tips over the trough. The curve also completes the start-up story: during the fast phase not a single drop reaches the trough. The shallow stream does not fill the tubes, and only when the water at the wheel has risen, after about 29 s, does the first water arrive at the top.
A few ways to look at that number:
- Per day: about 455 m³, since the wheel does not stop at night. At a ballpark demand of 10 mm of water per day, that keeps roughly 4.5 hectares of paddy field flooded, which is about six football pitches.
- In buckets: some 45,000 ten-liter buckets per day, each carried three meters uphill. This is the labor the wheel sets free.
- From the river’s point of view: half a percent of the 1.125 m³/s passing by. The stream barely notices the withdrawal.
The delivered volume can also be cross-checked independently. The flow rate through the channel cross section drops by 4 to 5 l/s between the section upstream and the section downstream of the wheel, once the slow filling of the channel is accounted for. That matches the water counted in the trough.
What the Stream Feels

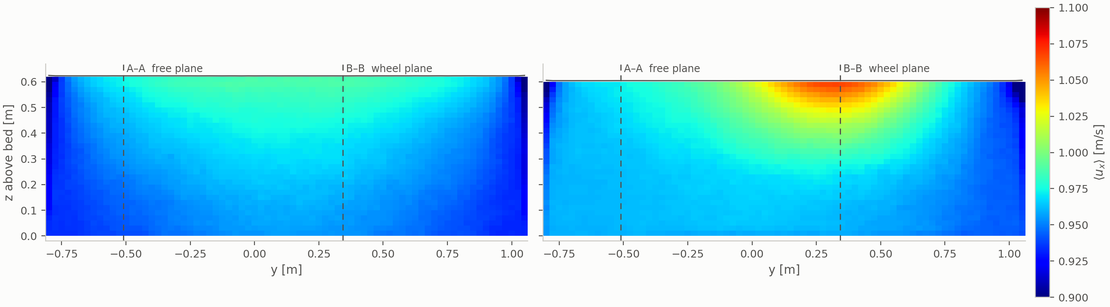
The wheel is not a subtle object: 4.2 m across, half a meter deep in the water, and blocking a good part of the channel width. The plan view of the depth-averaged velocity shows how the stream deals with it. Two things stand out. Beside the wheel, the water in the free lane speeds up as it is squeezed past the obstacle. Behind the wheel, a band of faster water trails downstream in the wheel lane, while the strip behind the bamboo tubes, between the wheel and the bank, is noticeably slower. Both features remain visible for several meters, and both stay in their lane.
The two longitudinal sections show what happens over the depth.
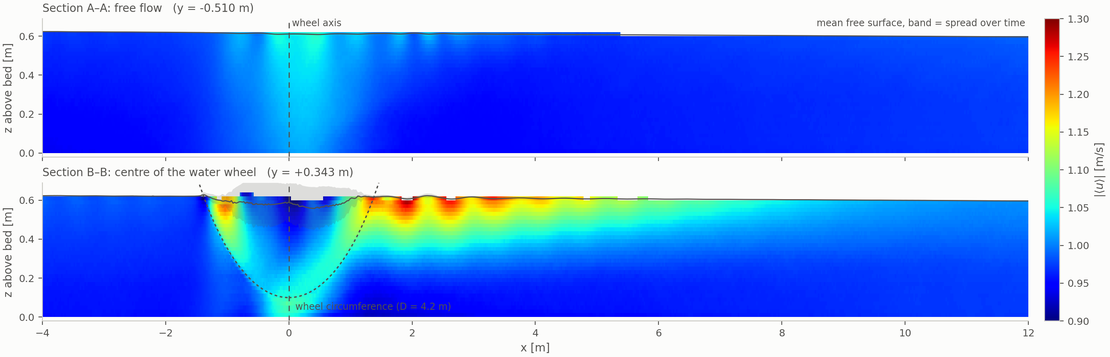
- Free lane (A-A): The velocity stays between 0.94 and 1.06 m/s over the entire length. The only visible feature is the slight acceleration next to the wheel, with the peak level with the axle. Otherwise the lane does not know the wheel is there.
- Wheel plane (B-B): Here the velocity ranges from 0.89 to 1.28 m/s. Upstream of the axle the surface water accelerates into the paddles, inside the wheel the fast zone follows the circumference, and behind the wheel a jet leaves along the surface.
- The jet: It is fastest 1.5 to 2.5 m behind the axle, at 1.28 m/s, still runs at about 1.15 m/s 3 to 4 m behind, and has faded to within a few percent of the inflow velocity 8 to 10 m downstream. It occupies the upper 15 cm or so of the water column. Underneath, the water is slower than upstream.
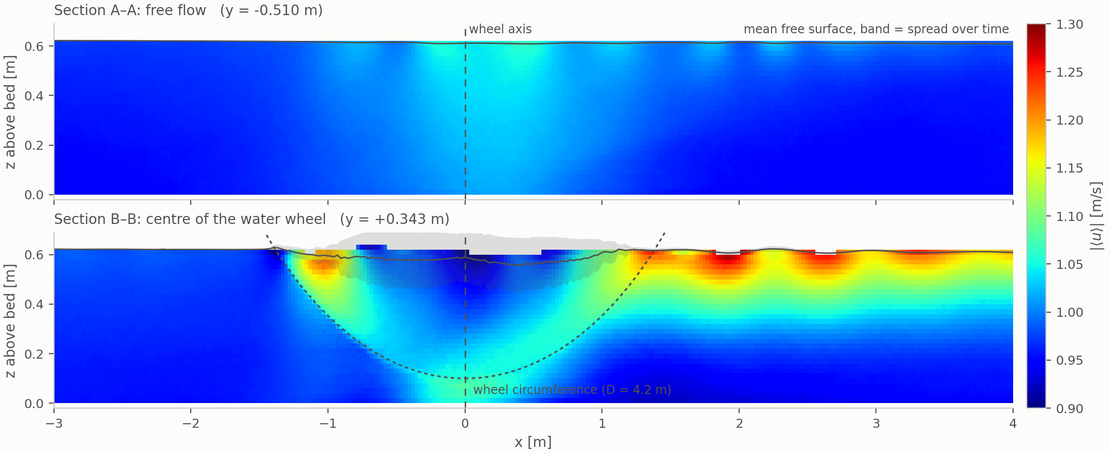
The close-up explains where the jet comes from. Upstream of the axle, the surface water accelerates to about 1.2 m/s as it enters the wheel, slightly faster than the 1.1 m/s at which the paddle tips travel: this is the push that keeps the wheel turning. Inside the wheel the fast zone follows the paddles down along the circumference and up again, while the water between the paddles near the surface is carried along more slowly and the surface itself sits a few centimeters lower. On the downstream side the paddles rise out of the water and the fast surface layer continues on its own as a jet.
The jet looks like the wheel is speeding the river up, which would be a neat trick. It is not. Averaged over the whole cross section, the velocity 4 m upstream and 7 m downstream of the wheel is the same to within one percent, 0.96 and 0.97 m/s. The wheel only redistributes the flow: fast near the surface in its own lane, slower underneath and beside it.
How Long the River Remembers
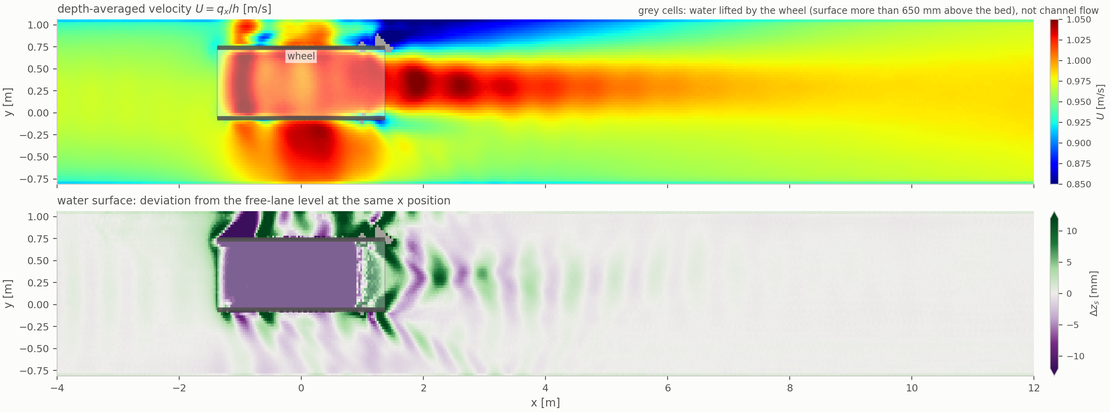
The water surface tells the same story from above. Upstream of the wheel it is flat across the width. Beside the wheel, the free lane dips by about a centimeter where the water accelerates past the obstacle. Behind the wheel, the surface carries a pattern of oblique standing waves about a centimeter high, like the wake of a slow boat, and this pattern has faded within about 4 m.
There is no backwater. Upstream of the wheel the surface follows the slight slope of the channel, about one millimeter per meter, with no rise in front of the wheel. Farmers further up the stream have no reason to complain.
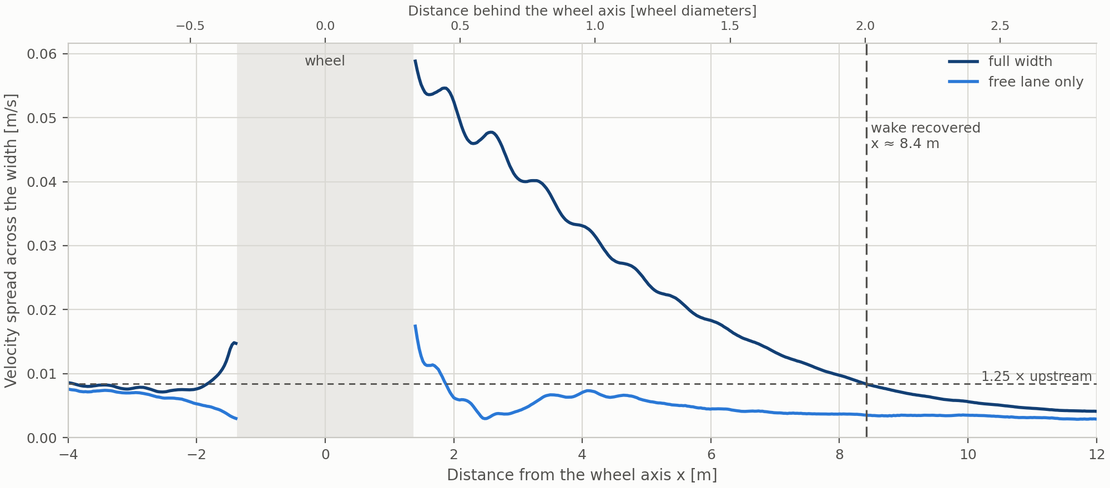
To put a number on the wake: directly behind the wheel the velocity is almost nine times less uniform across the width than upstream. From there the spread falls off steadily and drops below the threshold 8.4 m behind the axle, two wheel diameters, or 7 m behind the downstream edge of the wheel. Further on, the river is as uniform as it was before. The free lane does not take part in any of this: its spread right behind the wheel is the same as upstream, and a few meters further it is even smaller.
Two Wheels in One Stream
If a single wheel takes half a percent of the stream, the obvious next question is: why stop at one? Where a river allowed it, wheels were often built in groups. So the model got a second wheel, identical to the first, with its own trough, flume, and rice field. It stands 6.5 m downstream of the first one and is shifted about 0.6 m towards the opposite bank, so that most of its paddles run in the lane that has passed the first wheel undisturbed. Everything else, from the inflow to the sill, is unchanged.
The result is short, because the two wheels hardly take notice of each other. Averaged over 60 to 70 s:
| Wheel speed | Delivered to the trough | |
|---|---|---|
| Single wheel (reference) | 4.98 rpm | 316 l/min |
| Wheel 1 (upstream) | 4.96 rpm | 314 l/min |
| Wheel 2 (downstream) | 5.03 rpm | 320 l/min |
| Both wheels together | 634 l/min |
The first wheel does not feel the second one behind it: its speed and its delivery change by less than one percent, which is within the ripple of the paddle passages. The second wheel stands within the stretch in which the wake of the first has not fully faded, but its paddles mostly run beside that wake, and it turns just as fast and lifts just as much water as the first.
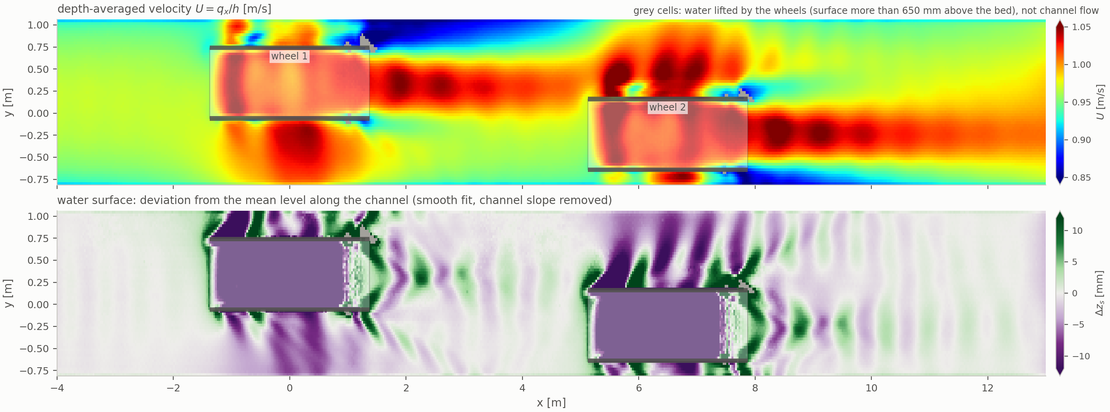
The plan view shows how the two wakes line up. The fast band behind the first wheel runs into the upper half of the second wheel and its tubes, while the paddles of the second wheel mostly sit in the former free lane. Behind the second wheel, a new fast band trails along that lane to the end of the channel, and the water surface carries the same oblique standing waves of about a centimeter as behind the first.
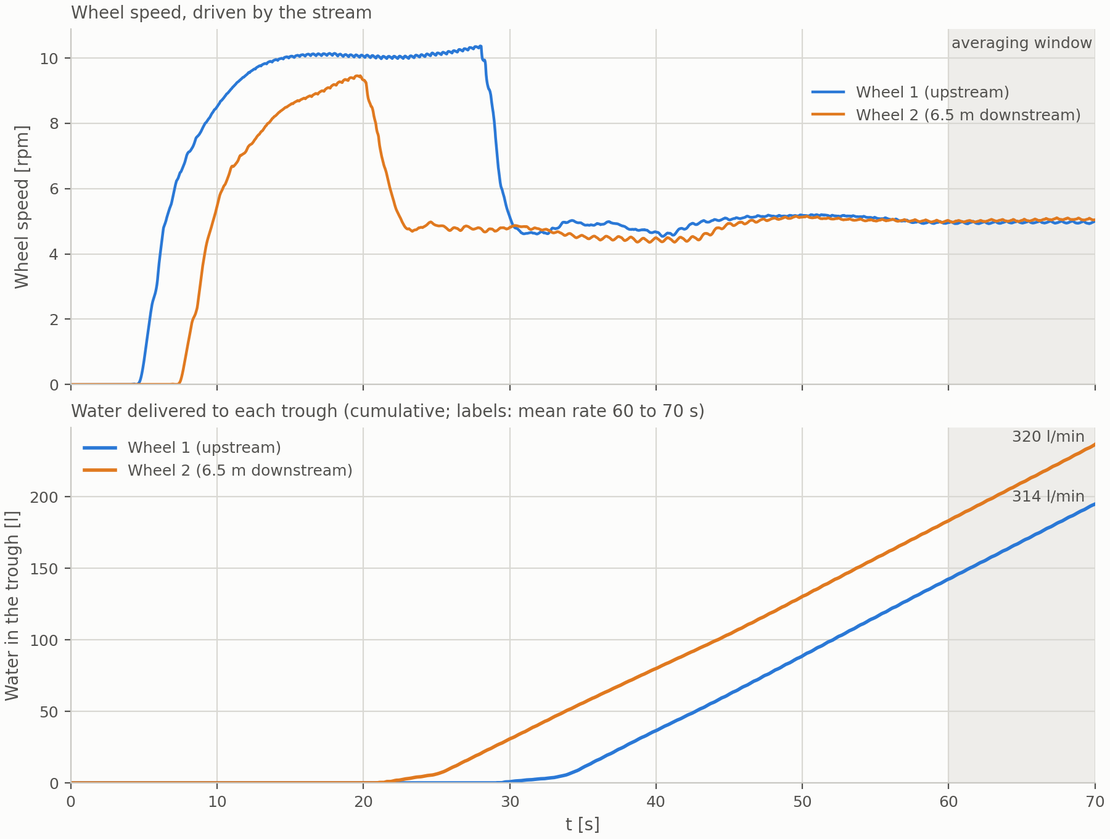
The only visible difference is in the start-up. The second wheel is closer to the sill, so the backwater reaches it about 8 s before the first wheel. It drops to its operating speed earlier, and its first water arrives in the trough at 21 s instead of 29 s. After about 50 s both wheels run in step.
Two wheels deliver twice the water: about 910 m³ per day, enough for roughly nine hectares of paddy, while the stream gives up just one percent of its flow. Seen from the river, there is room for many more.
Summary
In this case study, a traditional Chinese bamboo-tube water wheel was simulated together with the stream that feeds it: 21 m of open channel flow, a 4.2 m wheel that the stream itself keeps turning through the free surface, and 16 bamboo tubes that scoop, lift, and pour.
The wheel delivers 316 liters per minute to a trough three meters above the water, about 455 m³ per day and enough for several hectares of rice. It takes half a percent of the water from the stream. It causes no measurable backwater, its wake stays in its own lane, and two wheel diameters downstream the river has forgotten that the wheel was there. A second wheel in the same stream runs just as well, leaves the first one undisturbed, and doubles the water for the fields.
On the simulation side, everything that makes this machine awkward for mesh-based CFD is routine for a particle method: a rotating body cutting through a free surface, water leaving the main flow in small detached volumes, and free jets falling into a trough. All of it runs in a single transient simulation with up to 8.8 million particles, and the same particle data yields both the pictures and the numbers, from the liters in the trough to the wake behind the wheel.
The engineers who designed this wheel had no simulation, no velocity fields, and no particle count. They had a river, bamboo, and several centuries of patience. The result holds up rather well.
Case set-up
| Fluid | Water |
| Inflow | 1.125 m³/s |
| Water depth | 0.6 m |
| Wheel diameter | 4.2 m |
| Bamboo tubes | 16 |
| Lift height | approx. 3 m |
| Delivered water | 316 l/min |
| Simulated time | 70 s |