Parabolic flights are the only way to create true weightlessness on Earth for more than a few seconds, and they remain an essential platform for microgravity research, astronaut training, and hardware qualification. A single parabola compresses an extreme acceleration history into just over a minute: from level flight, the aircraft pulls up into a steep climb at 1.8 g, is “injected” into a ballistic arc with 22 seconds of near-zero gravity, and recovers with a second 1.8 g pull-out before returning to level flight.
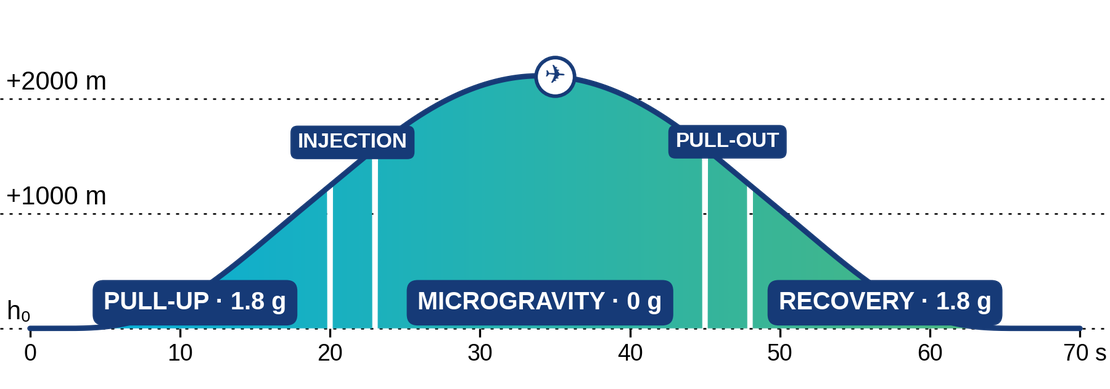
For the fuel system, this maneuver is anything but routine. Within 70 seconds, the kerosene in the partially filled wing tanks experiences accelerations that swing from nearly twice its normal weight to virtually none at all, while the entire airframe pitches from +47° nose-up to −47° nose-down. Under hypergravity the fuel is pressed hard against the tank structure; in the microgravity phase the notion of “down” disappears entirely and the liquid is governed by inertia alone. The critical moments are the transitions: when 1.8 g collapses to 0 g within three seconds, and especially when gravity returns just as abruptly and the redistributed fuel slams back onto the tank walls and baffles. Large fuel masses migrating through the tank shift the aircraft’s center of mass, load the internal structure, and can temporarily uncover feed points, all at the moment when precise, predictable aircraft handling matters most.
The microgravity phase also pushes against a hard limit of the aircraft itself: its engines. Conventional fuel systems are built around gravity: fuel settles at the bottom of the tank, where it reliably covers the inlets of the feed pumps. In weightlessness this ordering disappears: the fuel floats freely within the tank, the pump inlets can become uncovered, and the normal fuel supply to the engines is interrupted. The engines then run on the buffer of fuel trapped in the feed lines and collector cells, a reserve on the order of half a minute of operation, and engine lubrication systems tolerate weightlessness for similarly limited periods. The duration of the microgravity phase is therefore not just a question of trajectory: it must stay safely within the time window the engines can bridge without a settled fuel supply. What the fuel actually does inside the tanks during that window is exactly what this simulation makes visible.
Flight testing these effects is expensive and offers very limited visibility into what actually happens inside the tank. Simulation closes this gap: it makes the internal fuel motion visible throughout the full maneuver, quantifies the loads on baffles and tank walls, and allows tank layouts and fill levels to be evaluated long before an aircraft leaves the ground.
Case Description
Geometry
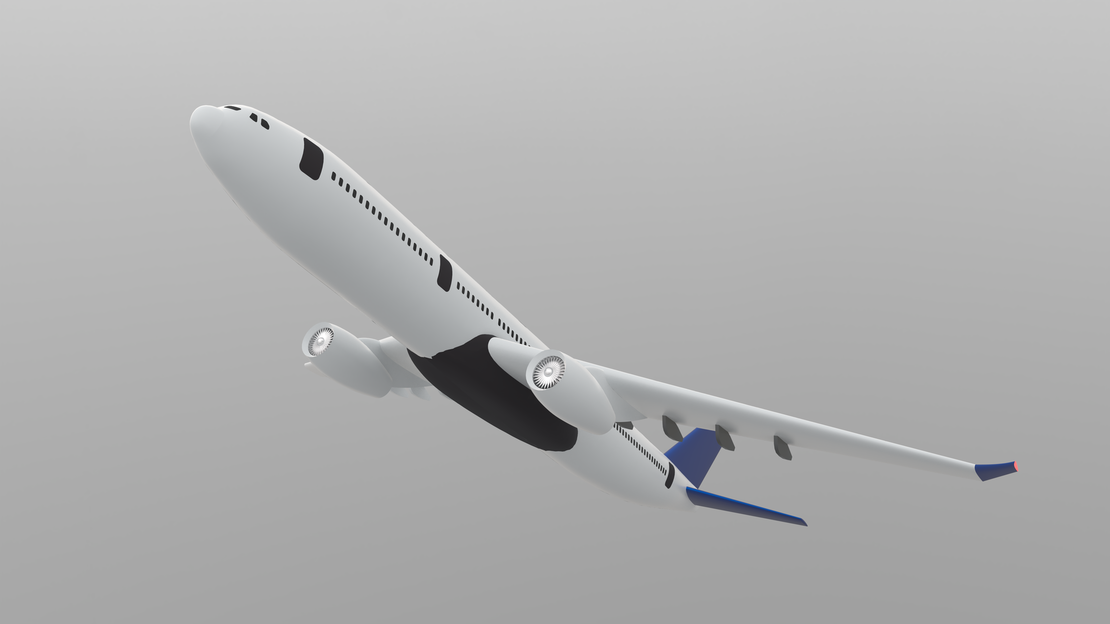
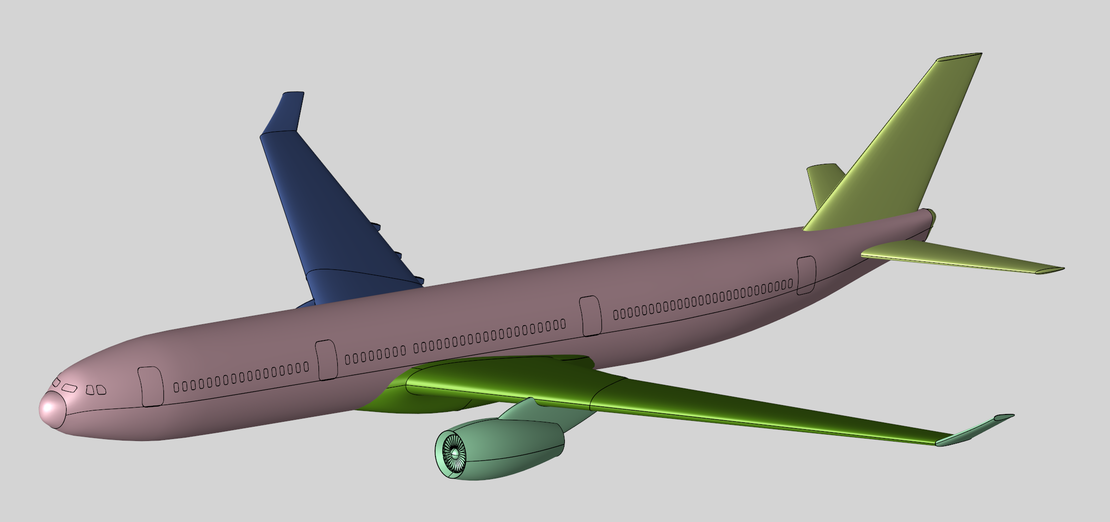
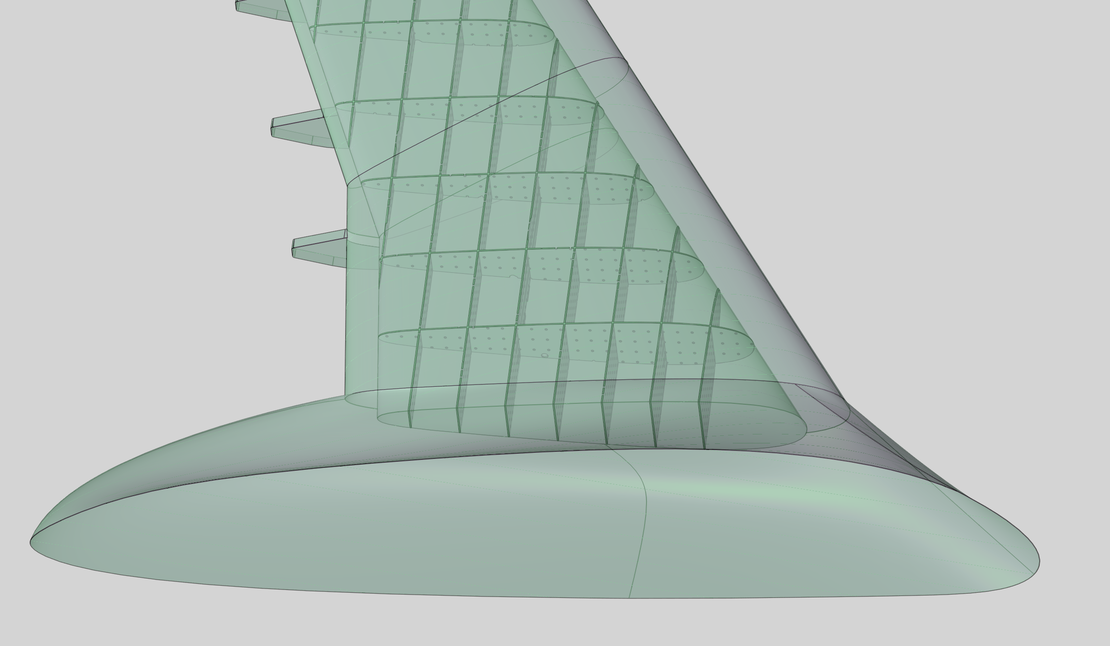
The simulation model uses an aircraft geometry inspired by the Airbus A330. The airframe originates from a publicly available CAD model on GrabCAD and serves purely as a visually appealing stage for this showcase. The fuel tank and its internal baffles were created specifically for this study: they are not part of the GrabCAD model, are not based on any official geometry, and make no claim to represent the real aircraft. The tank simply follows a generic multi-cell layout typical of aircraft wing tanks. The sole purpose of the geometry is to demonstrate how the fluid behaves under the conditions of a parabolic flight.
For the simulation, all structural components were united into a single rigid body; the internal baffle plates remain part of this body and act as flow obstacles within the tank. The analysis itself considers only the tank in the left wing, so strictly speaking only this part of the geometry is needed. The full aircraft is nevertheless included for visualization, while the focus of the simulation remains the fluid behavior in the left wing tank.
Fluid and Simulation Setup
The tank contains kerosene, modeled as a Newtonian liquid. The tank is partially filled: the initial fuel distribution is generated from a horizontal liquid level corresponding to the fuel volume given below.
| Parameter | Value |
|---|---|
| Fluid | Kerosene |
| Fluid density | 825 kg/m³ |
| Surface tension | 0.03 N/m |
| Fuel volume | 15 m³ |
| Particle radius | 6.5 mm |
| Particle count | 6.8 million |
| Simulation time | 70 s |
| Max. load factor | 1.8 g (pull-up / pull-out) |
| Max. pitch rate | 4.92 °/s |
Deliberately outside the scope of the model are airframe vibrations (which would add minor surface perturbations), droplet-scale surface-tension effects in 0 g (negligible for tanks of this size), and aerodynamic loads on the tank structure.
Modeling the Maneuver: Gravity Variation plus Physical Pitch Rotation
The central modeling idea of this study is that the aircraft never translates through the computational domain. Instead, the complete maneuver is transferred into the body-fixed reference frame of the aircraft through two coupled, time-dependent model inputs:
- A time-dependent gravity vector reproduces the load factor history (1 g → 1.8 g → 0 g → 1.8 g → 1 g) and the longitudinal deceleration and acceleration of the aircraft. From the fuel’s point of view, a change of the apparent gravity is physically identical to an acceleration of the tank, so braking and load-factor changes can be imposed simply by modulating the body force acting on the fluid.
- A physical rotation of the geometry reproduces the pitch attitude (0° → +47° → −47° → 0°). The airframe is driven by a rotational joint about the spanwise (x-) axis, controlled by a tabulated pitch-rate profile , the rate of change of the pitch angle .
Splitting the maneuver this way has a practical advantage: because the geometry visibly rotates, the visualization is far more intuitive than with a pure gravity-vector approach, since the fuel can be watched climbing along a tilting wing. Since the pitch attitude is covered by the physical rotation, the gravity vector deliberately contains no pitch-angle component:
Here is the load factor as a multiple of the standard gravity , and is the rate of change of the airspeed , i.e. the acceleration along the flight direction. The vector carries only:
- : no roll; the problem is symmetric.
- : the tangential acceleration along the flight direction (max ±2.79 m/s², i.e. 0.285 g). During the pull-up, kinetic energy is converted into potential energy and the aircraft slows from 650 to 530 km/h; during recovery the process reverses. This longitudinal pseudo-force is not covered by the pitch rotation and must therefore remain in the gravity vector. During the 0 g phase, : in free fall no tangential force component exists in the body frame.
- : the load factor, always acting vertically in the body-fixed system.
The injection speed follows directly from the maneuver geometry: a 22-second ballistic phase requires , giving (530 km/h).
The full maneuver consists of nine phases:
| Phase | Duration | Load factor | Pitch angle |
|---|---|---|---|
| Level flight | 2 s | 1.0 g | 0° |
| Pull-up ramp | 15 s | 1.0 → 1.8 g | 0° → +47° |
| Pull-up hold | 3 s | 1.8 g | +47° |
| Injection | 3 s | 1.8 → 0 g | +47° (held) |
| Microgravity | 22 s | 0 g | +47° → −47° |
| Pull-out | 3 s | 0 → 1.8 g | −47° (held) |
| Pull-out hold | 3 s | 1.8 g | −47° |
| Recovery | 15 s | 1.8 → 1.0 g | −47° → 0° |
| Level flight | ~4 s | 1.0 g | 0° |
The total simulated duration is 70 s. The dynamic maneuver ends after 66 s, followed by roughly 4 s of level flight in which the fuel settles back toward its steady state.
The complete maneuver definition is summarized in the figure below: the load factor (first panel), the pitch angle together with the airspeed (second panel), the resulting body-frame gravity components and (third panel), and the magnitude of the effective gravity acting on the fuel (fourth panel). The shaded bands mark the active phases of the parabola.
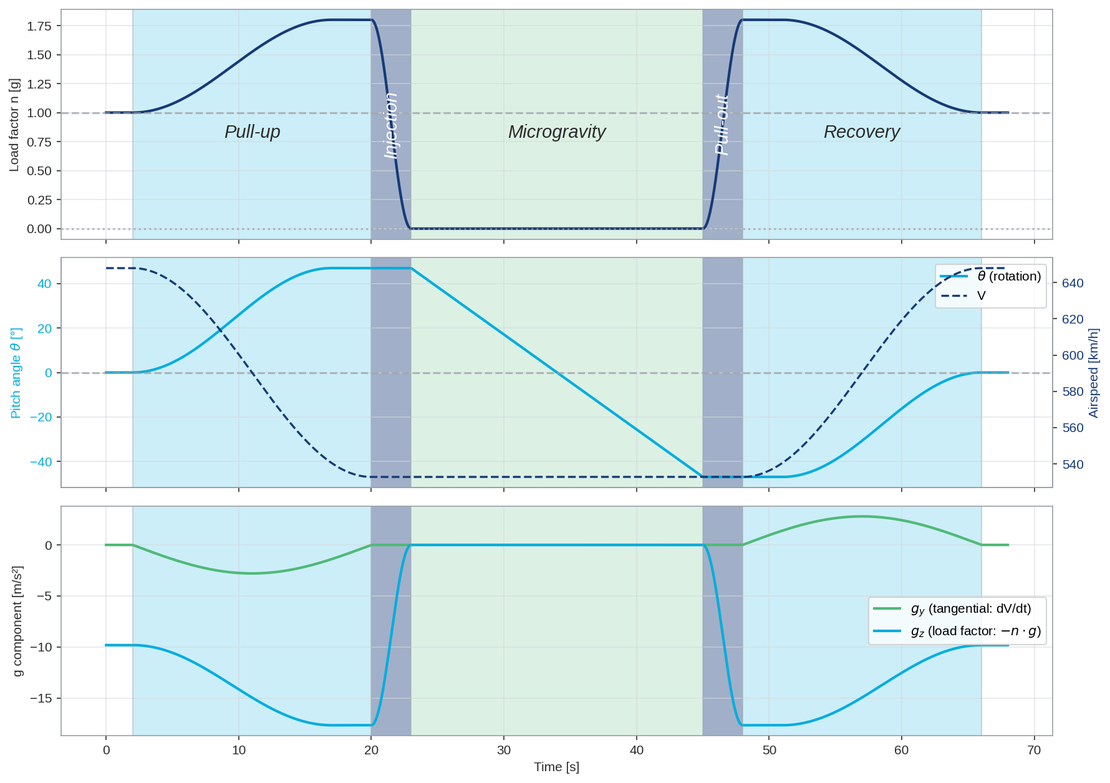
As the first panel shows, all load-factor transitions use smooth cosine ramps, avoiding non-physical jumps in the body force. The pitch motion during the ballistic phase (second panel) is modeled as linear, i.e. a constant pitch rate. In a real parabola the rotation is somewhat faster around the apex, where the horizontal speed is lowest, but since the apparent gravity is zero throughout this phase, the simplification has no effect on the body force acting on the fuel. Pitch and load factor are deliberately synchronized so that the pitch-down motion takes place entirely within the 0 g phase: the attitude holds at +47° throughout injection and reaches −47° exactly when the ballistic phase ends, reflecting the fact that the pitch-over belongs to free fall, not to the powered transitions.
Results
Fuel Behavior Through the Parabola
The video follows the fuel through the complete parabola, and each phase leaves its own distinct signature in the tank:
- Pull-up (1.8 g): The fuel is pressed hard toward the tank bottom, while the growing pitch angle makes the fuel visibly reposition along the tilting wing.
- Injection (1.8 g → 0 g): Within three seconds the apparent gravity collapses from 1.8 g to zero. The hydrostatic pressure gradient vanishes and the previously compressed free surface begins to relax.
- Microgravity (0 g): The fuel largely remains in the compartments where the 1.8 g phase pushed it: weightlessness itself drives no new motion. What acts now are the weak effects, surface tension and the small impulses imparted by the tank walls as the aircraft rotates. Under their influence the floating fuel slowly redistributes within its compartments and forms new free surfaces. This surface development is examined in detail in the section “Free Surface Development”.
- Pull-out (0 → 1.8 g): Gravity returns as abruptly as it vanished, and the redistributed fuel slams back onto the tank walls and baffles. This is the load-critical event of the maneuver.
The following sections quantify what the video shows qualitatively: first the migration of the fuel’s center of mass, then the development of the free surface.
Center of Mass Migration
The fuel’s center of mass (CoM) was tracked over time in the aircraft frame. The vertical component is the most telling one: it captures how far and how fast the fuel mass travels in each phase, a key input for flight-mechanics and CG-envelope assessments.
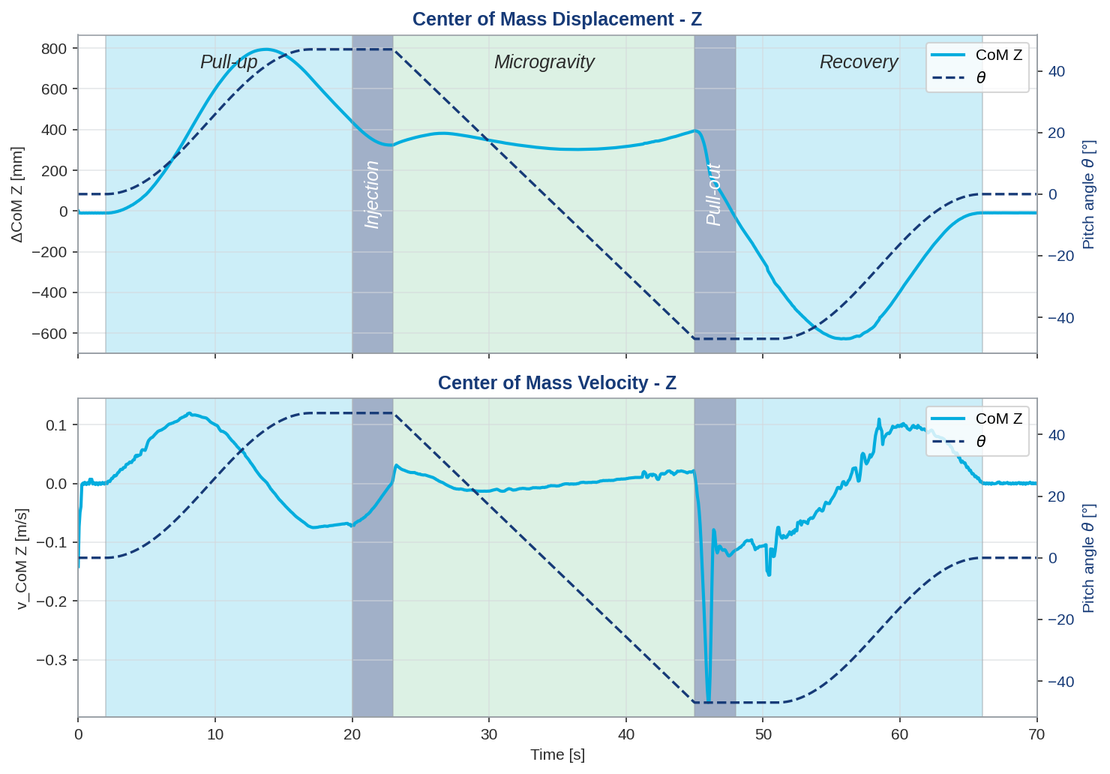
The displacement curve tells the story of the maneuver:
- Pull-up: As the wing rotates toward +47°, the fuel is carried upward with it while gravity simultaneously drives it back down the tilting tank. The baffles slow this backflow, so the rotation initially wins and the CoM climbs by almost 0.8 m. Once the wing reaches its maximum angle, the delayed backflow takes over and the CoM sinks again, settling near +0.35 m. Throughout this phase gravity keeps wing and fuel in an instant feedback loop: every change in attitude is answered immediately by the fluid.
- Microgravity: The wing rotates again, this time all the way from +47° to -47°, yet the curve stays nearly flat and the CoM velocity close to zero. Without gravity there is no restoring force to make the fuel follow the tank, and inertia keeps the floating fuel where it is. The wing motion is now almost completely decoupled from the fluid.
- Pull-out: The returning gravity abruptly re-couples the two. The floating fuel is pulled back onto the tank structure within about a second, with the CoM velocity peaking at 0.37 m/s, roughly three times faster than any motion during pull-up. This is the sloshing event of the maneuver.
- Recovery: After this initial slosh the phase mirrors the pull-up: with the nose pointing 47° down, the gravity-coupled fuel follows the tank attitude, undershoots to about -0.63 m, and returns smoothly to its initial position as the aircraft levels off.
In total the fuel center of mass sweeps through a vertical range of about 1.4 m during the maneuver, a shift that any CG-envelope assessment of such a flight profile has to account for.
Free Surface Development
While the center of mass tracks where the fuel goes, the free surface reveals what state it is in: a calm, settled liquid exposes little surface, while draining, sloshing, and freely floating fuel fragments into far more. The figure shows the free surface area extracted directly from the particle data, plotted as growth relative to the settled fuel surface in level flight.
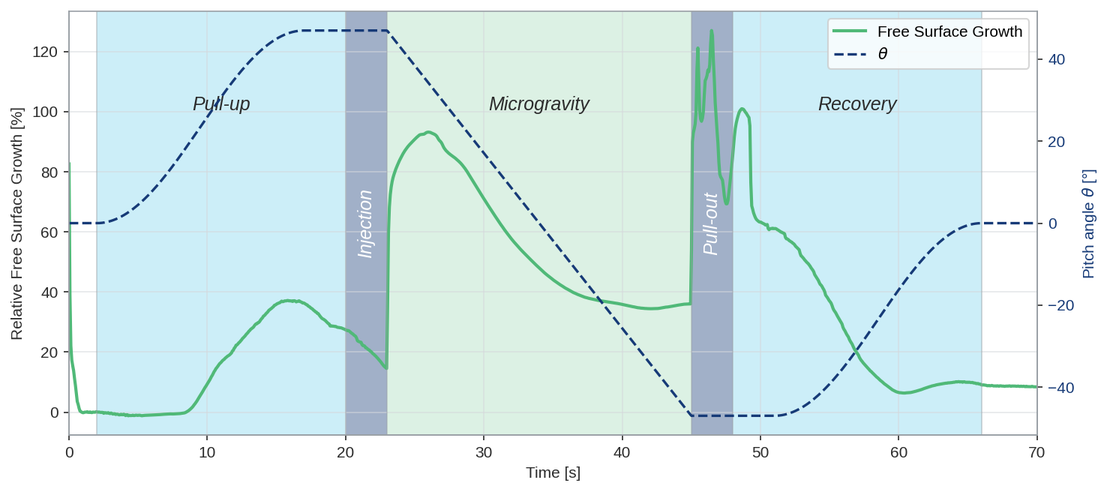
- Pull-up: The free surface grows steadily to roughly 40%. As the wing rotates, the fuel drains through the baffle openings from one compartment into the next, and each of these internal flows generates new surface. Once the pitch angle holds, the fuel resettles and part of this surface disappears again.
- Microgravity: The moment weightlessness is reached, the free surface jumps to over 90% within about a second: the fuel loses contact with the tank walls and floats freely in the compartments. Over the rest of the phase the exposed surface shrinks back to about 35%. Surface tension pulls the floating fuel together, since liquids tend to minimize their surface, and the slow rotation of the wing brings the fuel back into contact with the upper tank skin.
- Pull-out: The returning gravity produces the sharpest response of the whole maneuver. Within a second the floating fuel falls back to the tank bottom and sloshes against walls and baffles, briefly driving the free surface to more than 120% above its level-flight value.
- Recovery: The sloshing decays, the fuel calms down, and the free surface returns almost to its initial value as the aircraft levels off.
How this curve translates into actual fuel motion is easiest to see live. The video below combines a close-up rendering of the fuel with a raw simulation view in which the free surface is highlighted in color. Beneath both, the free-surface diagram runs in sync, a vertical line marking the current time, so every jump in the curve can be matched directly to what the fuel is doing at that moment.
Summary
In this case study, a complete parabolic flight maneuver of a transport aircraft was simulated to investigate the fuel motion in a partially filled wing tank, from level flight through 1.8 g pull-up, 22 seconds of microgravity, and the 1.8 g pull-out back to level flight.
The combination of a time-dependent gravity vector and a physical pitch rotation reproduces the complete maneuver without moving the aircraft through space. Transient particle-based CFD captures the full hyper- to microgravity transition in one continuous run, making the internal fuel motion visible in a regime where flight testing offers almost no insight.
The results condense into a few headline numbers. The fuel center of mass sweeps through a vertical range of about 1.4 m over the maneuver. In the gravity phases wing and fuel move in tight coupling, while in microgravity the fuel is essentially frozen and decoupled from the rotating wing, with its free surface briefly growing by over 90% as it loses wall contact. The critical event is the pull-out: within a second the returning gravity slams the floating fuel back onto the structure, with CoM velocities three times higher than anything during pull-up and a free surface briefly more than 120% above its level-flight value.
The setup is fully parametric and fast to build: g-levels, pitch limits, phase durations, and ramp shapes are defined in a single script, so the same approach transfers directly to other maneuvers such as emergency braking, gust loads, or coordinated turns.
Case set-up
| Fluid | Kerosene |
| Fluid density | 825 kg/m³ |
| Surface tension | 0.03 N/m |
| Fuel volume | 15 m³ |
| Max. load factor | 1.8 g |
| Microgravity phase | 22 s |
| Pitch range | ±47° |
| Simulated time | 70 s |